Introduction:
The understanding and prediction of world economic downfalls has become very important. After the recession in 2008, the interaction among the financial bodies has become even more complex. Thus it is very difficult to predict. However the prediction is really very important to prevent such economic downfalls in future and take appropriate measures. In this work, it has been shown that directed Clustering coefficient can be used as a measure of systemic risk in Interbank network.
Understanding the aggregate behaviour of economic and financial systems require tools belonging to the field of econometrics of times series, complex systems, game theory and agent-based models. Banking lending networks are one of the most important financial systems that are subjected to systemic risk, even small shocks constrained only to a few banks can be spread by contagion and affect the entire system.
In this work a new interpretation of clustering coefficients to measure systematic risk has been developed. These clustering coefficients have also been correlated with interest rates to show that the interbank topology changes with the macroeconomic environment. The Brazilian interbank network has been used in the study.


In this network, the banks in the centre are interconnected in triangular patterns and have high mutual exposures. The non-triangular patterns are rather rare in the centre, where the clustering coefficients are higher, and are not common on the periphery, where there are lower coefficients, which results in a negligible underestimation of them.
The understanding and prediction of world economic downfalls has become very important. After the recession in 2008, the interaction among the financial bodies has become even more complex. Thus it is very difficult to predict. However the prediction is really very important to prevent such economic downfalls in future and take appropriate measures. In this work, it has been shown that directed Clustering coefficient can be used as a measure of systemic risk in Interbank network.
Understanding the aggregate behaviour of economic and financial systems require tools belonging to the field of econometrics of times series, complex systems, game theory and agent-based models. Banking lending networks are one of the most important financial systems that are subjected to systemic risk, even small shocks constrained only to a few banks can be spread by contagion and affect the entire system.
In this work a new interpretation of clustering coefficients to measure systematic risk has been developed. These clustering coefficients have also been correlated with interest rates to show that the interbank topology changes with the macroeconomic environment. The Brazilian interbank network has been used in the study.
Clustering coefficients for directed
networks
Let A and W be the directed
adjacency matrix and directed matrix of weights that represents the network. Let also dini , douti
and dtoti = dini
+douti be
respectively the in-degree of node i, the
out-degree of node i, and the total degree of node
i. Furthermore, let d↔ =∑ j≠i aijaji
= A2ii. In
binary directed networks, the clustering coefficient of node i
for a binary network may be defined as the ratio between all the
possible triangles formed by i and the number of all possible
triangles that could be formed
CDi
(A) =(A
+ AT )3ii
/(2[dtoti
(dtoti − 1) − 2d↔i ]) (1) This
clustering coefficient defined for the unweighted case. This can be easily
extended to the weighted case by replacing the number of directed triangles formed
with its weighted counterparts
˜ CDi
(W) =[Wˆ + (Wˆ T )]3ii
/(2[dtoti
(dtoti − 1) − 2d↔i ]) (2)
where Wˆ = W[ 1/3] = [w1/3ij
].
However, these two definitions (1) and (2) are not enough to characterize the richness of patterns that take place
in a complex directed network. In fact, Eqs. (1) and (2) treat all the possible
triangles as if they were the same.However, in directed graphs, edges that
point to different directions should be interpreted differently. Thus four definitions are
necessary which are represented in Fig. 1.
(a)
Cycle when there is a
cyclical relation among i and its neighbours. The clustering coefficients for
binary case is
Ccyci= (A)3ii/(dinidouti-
d↔I
)
and for weighted case is given by
˜ Ccyci= (Wˆ)3ii/(dinidouti-
d↔I
)
.
(b)
Middleman, when one of the neighbours of node I holds two
outward edges and the other holds two inward edges. In this case the associated
clustering coefficient for the binary case is
Cmidi=
(AATA)ii/(dinidouti-
d↔I
)
and for weighted case is given by
˜ Cmidi=(WWTW)ii/(dinidouti-
d↔I
)
(c)
In, when i holds two inward edges. In this case, the associated
clustering coefficient for binary case is
Cini= (ATA2)ii/
(dini(dini-1))
and for weighted case
is given by
˜ Cini=
(Wˆ T
Wˆ 2)ii/ (dini(dini-1))
(d)
Out, when i holds two outward edges. In this case, the
associated clustering coefficient for the binary case is
Couti=
(A2AT)ii/ (douti(douti-1))
and for weighted case is given by
˜ Couti=
(Wˆ 2Wˆ T)ii/ (douti(douti-1))
Unweighted clustering coefficient
counts the number of triangles of a given type. Weighted clustering coefficient
is strongly affected by the largest weights.
In the following discussion it is assumed that an edge that arrives to
node i coming from node j means that bank i borrowed money from bank j, that is
bank j lent money to bank i. The four patterns in Fig. 1 have different
interpretations of systematic risk.
In Fig.1(a), bank i lends to bank j,
which lends to bank h, which in turn lends back to bank i. therefore large
values do not represent higher risk in this case. In Fig. 1(b) , the
counterparts of bank I, bank j and h , are either borrowing or lending from the
other two banks . In this case large value imply a higher risk as bank i is at
the same time exposed to risk and source of risk of the other banks. Fig. 1 (c) presents the case in which ˜ Cini bank i is borrowing from both the
banks. Here bank i is increasing the risk of banking system. If bank i fails
then it will not pay some or all the loans that is has made and subsequently
the other two banks may not be able to meet their obligations with each other.
Therefore the loss in the system will increase. In Fig. 1 (d), ˜ Couti bank i is increasing it’s own
exposure as it is lending to two counterparties. If one of these bank fails, as
it may not pay the other bank the losses suffered from bank i may increase.
Thus if this clustering coefficient is high, we can say that bank i has a large
exposure and higher risk within interbank network. Overall, high values of
coefficients ˜ Cmidi and ˜ Cini imply high systemic risk and high
value of ˜ Couti imply higher
exposure of bank i. High clustering coefficients are associated with high
exposures, however low coefficients do not mean low exposure, as networks in
which banks are interconnected without forming triangles have all their
clustering coefficients equal to zero although their exposures are non-zero.
The data has been collected on daily loans made
between financial institutions within Brazilian financial system for all banks
and financial institutions that have exposure in interbank market , for the
period from January 2004 to November 2007.
Results
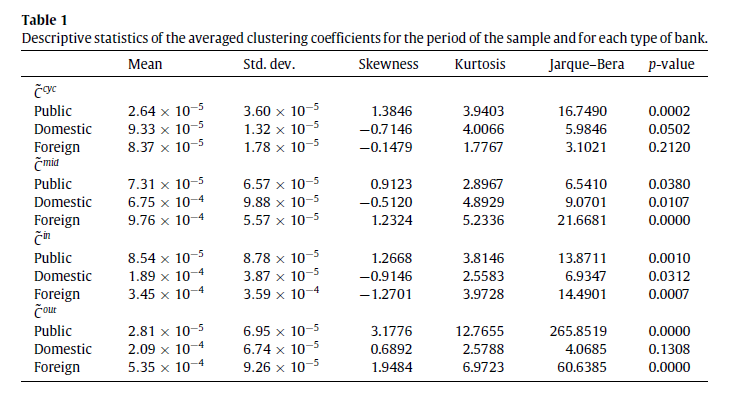
Firstly the frequency of each of the
patterns of lending as presented in Fig. 1 is studied, since there is a relation
between systemic risk and pattern of lending. Table 1 presents the statistics
of averaged clustering coefficients for the period of the sample and for each
type of bank. It is observed that there is a large heterogeneity between banks
which is evident from the figures which are not Gaussian.
Fig 2 shows the evolution of the clustering
coefficients over time, reinforcing that different bank types have different
strategies when dealing with the interbank market. Although the clustering
coefficients vary strongly over time, most of them vary around their mean
value. The Pearson correlation is calculated between
the daily clustering coefficients and basic interest rates, employing the daily
CDI interbank interest rate as a benchmark for interest rates in Brazil. Here a negative correlation
between the ˜ Cmid coefficient and changes of
CDI interbank interest rates, which imply that as interest rate increase, banks
decrease their relative exposure in the network. The correlation coefficients
for all, public, domestic and foreign banks with interest rates are -0.257423,-0.136349,-0.302239 and -0.370078 respectively. This shows that
different banks pursue different strategies which may be due to diversity in
obtaining funds domestically and internationally.

In this network, the banks in the centre are interconnected in triangular patterns and have high mutual exposures. The non-triangular patterns are rather rare in the centre, where the clustering coefficients are higher, and are not common on the periphery, where there are lower coefficients, which results in a negligible underestimation of them.
These coefficients can be used to refine results obtained
for individual banks as introduced by Brink and Gilles, given by
βBi=∑j(wji/∑kwjk)
where wjk
is the exposure’s matrix, in which bank j owes wij to bank i.
In
this case, the bank i’s dominance measure represents the sum of the participations
of its debts on their creditors’ exposures; but to measure risk, it would be
more useful to take into account the creditors’ provisions for losses or
capital, instead of their total exposure, as in
βi=∑j(wji/Ej)
Where
Ej is the creditor j’s provision for losses or capital. This measure gives the
shock provoked by an occasional default of bank i on its creditors. This
measure is complemented by the ˜ Couti weighted
clustering coefficient. A bank with high ˜ Couti
has large debts and is involved on strong exposure relationships, when compared to the entire banking
network. Thus, if a bank possesses high βi and ˜ Couti, it is a strong candidate to be a
source of systemic risk, which can be further
studied.
Conclusion:
In this work the directed clustering coefficient is used as a measure of systemic risk. It has been shown that the clustering coefficients measure vary over banks and are negatively correlated with changing interest rates. More research can be done to exploit in depth how the topology of interbank network changes.
References:
1> Directed clustering coefficient as a measure of systemic risk
in complex banking networks ,Benjamin M. Tabak, Marcelo Takami, Jadson M.C. Rocha,
Daniel O. Cajueiro , Sergio R.S. Souza, (Physica A 394 (2014) 211–216)
2>F. Allen, D. Gale, The Journal of Political Economy 108 (2000) 1–33
Hallo dort, Ich habe gerade ein wenig Zeit mit dem Lesen durch Ihre Beiträge, die fand ich ganz aus Versehen bei der Untersuchung eines meiner Projekte.
ReplyDeleteIch habe einige relevante Informationen, die Sie unten überprüfen können
BDSwiss