During this World Cup season, it will be interesting to look into a model for analyzing cricket strategies using complex network tools. As we know cricket is a game involving interaction between the two batsmen who are presently batting and between the batsmen and the bowlers. Using partnership data available from crickinfo, we can construct a partnership graph among batsmen within a team and analyze certain properties of this graph to infer the important players in a team, winning strategies for the bowling team, etc.
Measuring the performance of batsmen in a team
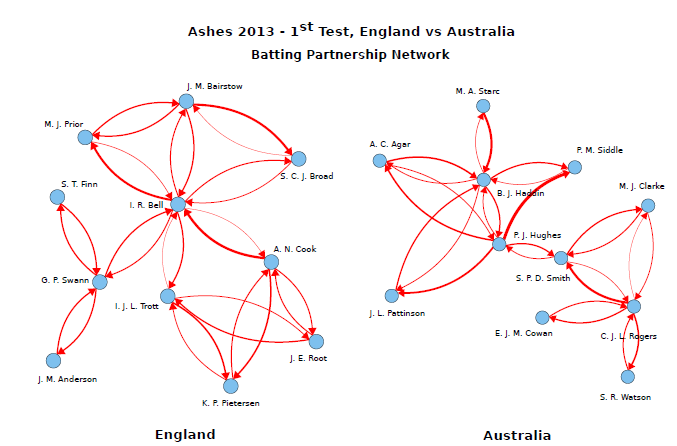
We can generated weighted directed graph for all the players in a team and one such graph per all the teams in a tournament. The weight of a link is equal to the fraction of runs scored by a batsman to the total runs scored in a partnership with another batsman. Thus if two batsmen A and B score n runs between them where the individual contributions are nA and nB, then we draw a directed link of weight nA/n from B to A. Figure 1 shows an example of weighted and directed batting partnership network for two teams - Australia and England in Ashes 2013 test series.
 where wji is given by the weight of the directed link.


As we know these players, we can try to draw conclusions from this table. The betweenness centrality of IR Bell is the highest among all the players. The fact that in the second innings of the first Test at Trent Bridge, he scored 109 when England were 121 for 3 supports this argument. He was able to add 138 runs for the seventh wicket with the tail-ender Broad, and helped England post a target of 311. According to the centrality score IR Bell was the most deserving candidate
for the Player of the match award (Although Mitchell Johnson-4/61 (17 overs) was the man of the match because of his bowling figures which is not captured by this model). Similarly the performance of other players can also be evaluated.
To summarize, this study reveals that network analysis is able to to give a performance score for batsmen in a team. Other than providing a visual summary of the match, partnership graph can be used to measure the popularity and importance of players in a match. Further analysis of the matches in the test series reveals that Australia was highly dependent on the batsmen while England was playing a team-game. By adding additional fields such as "athletic index" of a batsmen and fielding network, we can further capture the difficulty faced by the batsmen while batting.
Reference: Ashes 2013 − A network theory analysis of Cricket strategies, Satyam Mukherjee.
Measuring the performance of batsmen in a team
We can generated weighted directed graph for all the players in a team and one such graph per all the teams in a tournament. The weight of a link is equal to the fraction of runs scored by a batsman to the total runs scored in a partnership with another batsman. Thus if two batsmen A and B score n runs between them where the individual contributions are nA and nB, then we draw a directed link of weight nA/n from B to A. Figure 1 shows an example of weighted and directed batting partnership network for two teams - Australia and England in Ashes 2013 test series.
Fig. 1
We use the following centrality scores to measure the individual performance of the players within a team :
- In-strength: For a weighted directed graph, the in-strength s(i)in is defined as
where wji is given by the weight of the directed link.- Page Rank: To quantify the popularity of a player, we use Page Rank as a measure. To begin with, each node is given a uniform probability of 1/N and then using the Page Rank equations, we iterate till a steady state is reached. It is to be noted that the PageRank score of a player depends on the scores of all other players and needs to be evaluated at the same time. The transportation probability q is taken as q=0.15. This choice of q ensures a higher value of PageRank scores. The Page Rank of a player is calculated as:
- Betweenness Centrality: In cricketing terms, betweenness centrality gives a measure of how the runs scored by a player during a partnership depends on the other player. High betweenness centrality batsmen tend to score runs without loosing his wicket. These batsmen are highly important in a team because their dismissal impacts the network structure. In other aspect, having only a few players with high betweenness centrality indicates an unbalanced team which is highly dependent on a few batsmen. In an ideal case, every team would seek a combination of players where betweenness scores are uniformly distributed among players. The winning strategy for the opponent team would be to get these batsmen out as quickly as possible.
- Closeness Centrality: It measures how well connected a player is in the team. Batsmen with high closeness centrality tend to be more flexible team players in the sense that they can perform well independent of the changes in batting order according to the game conditions.
for the Player of the match award (Although Mitchell Johnson-4/61 (17 overs) was the man of the match because of his bowling figures which is not captured by this model). Similarly the performance of other players can also be evaluated.
To summarize, this study reveals that network analysis is able to to give a performance score for batsmen in a team. Other than providing a visual summary of the match, partnership graph can be used to measure the popularity and importance of players in a match. Further analysis of the matches in the test series reveals that Australia was highly dependent on the batsmen while England was playing a team-game. By adding additional fields such as "athletic index" of a batsmen and fielding network, we can further capture the difficulty faced by the batsmen while batting.
Reference: Ashes 2013 − A network theory analysis of Cricket strategies, Satyam Mukherjee.
No comments:
Post a Comment