Apps are important part of everyone’s lives. They exhibit a
rich temporal structure of user adoption and long-term engagement. Also social
ecosystem helps in driving the adoption and engagement of apps.
In the first part we will discuss the social properties of
apps and how user’s probability of adopting an app depends both on properties
of the local network structure and on the match between the user’s attributes,
his or her friends’ attributes, and the dominant attributes within the app’s
user population. In the second part we will develop a retention model that
represents a user’s tendency to return to an app.
We would like to place apps in a low-dimensional space that
can provide a view for how they are distributed across the social network of
users. To do this, we begin with two basic definitions
- We say that the popularity of an app, denoted p(x), is the probability that an individual selected uniformly at random from Facebook’s population is a user of the app.
- We say that the sociality of the app, denoted p(x|y), is the probability that a member of Facebook is a user of the app given that they have at least one friend using the app.
Studying the distributions of p(x) and p(x|y), and how they are jointly distributed across apps, allows us to ask a number of questions. In particular, how socially clustered is the app? And how does it depend on the type of app, or characteristics of the app’s users?
Moreover, p(x|y) can in principle be high even when p(x) is
low -- this would correspond to an app that is popular in a focused set of
friendship circles, but not on Facebook more broadly. On the other hand, if
p(x|y) is not much more than p(x), then it says that users of the app are
spread out through the social network almost as though each member of Facebook
independently flipped a coin of bias p(x) in order to decide whether to become
a user of the app -- there would be no effect of the social network at all.

Figure 1: App sociality. Top left: Horizontal axis is app
popularity, and vertical axis is the relative increase in adoption likelihood
for people who have friends who also use the app. Right panels: Horizontal axis
is app popularity, vertical axis is app sociality. The colors represent the
number of apps falling within the given bin. The labeled colors indicate the
relative frequencies of observations in each bin, such that the lowest values
have been normalized to 1.
We see in Figure 1 that the apps fill out a wedge-shaped
region in the p(x)-p(x|y) plane. If the
social network had no relationship to app usage, we would see the diagonally
sloping line p(x) = p(x|y); in the plot this corresponds to a line that lies
slightly below the diagonal lower boundary of the points in the heat map. Thus,
there exists a frontier in the space of apps that is almost completely asocial
— those apps that lie parallel to this diagonal line — but essentially no apps
actually reach the line; even the most asocial apps exhibit some social
clustering. We see this in the approximately horizontal top boundary of the
points in the heat map — this is a frontier in the space of apps where knowing
that a person x has a friend using the app gives you a fixed probability that x
uses it, independent of the app’s overall popularity on Facebook. The
wedge-shaped region in a sense has to come to a point on the right-hand side,
as p(x) becomes very large: once an app is extremely popular, there is no way
to avoid having pairs of friends using it almost by sheer force of numbers. And
given the crowding of app users into the network, there is also no way for the
extent of social clustering to become significantly larger than one would see
by chance.
For each app, we consider everyone on Facebook who has
friends using the app, but who has not used the app themselves by time t.
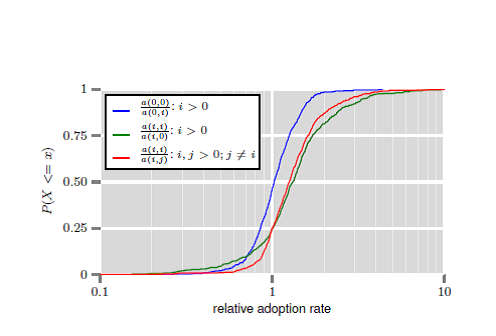
Figure 2: Relationship between national identity of
potential app adopters, that of their current user friends, and the likelihood
of their adopting the app. Blue: Relative adoption rates when a potential user
and their current user friend are from the majority to when potential user is
in majority and current user friend is in minority. Green: Relative rates when
potential user and current user friend are in same minority to when potential
user is in minority and current user friend is in majority. Red: Relative rates
for when potential user and current user friend are in same minority to when
they are in different minorities. The blue curve indicates that when a
potential user is from the majority country, their current user friend could be
from either the majority or a minority and they are still equally likely to
adopt an app more often as less. In contrast, when the potential user is from a
minority country, in 75% of apps they adopt more frequently when their current
user friend is from the same country as them.
Consider a Facebook user A who does not currently use the
app, and suppose that has exactly one friend B who uses the app (that is, A has
between 1 and 5000 friends on Facebook, but for our purposes here, exactly one
of those friends is an app user). We choose some attribute on users (for
example nationality, or age); we let f(A) and f(B) denote the value of this
attribute for A and B, and we let f* denote the modal (or median) value of the
attribute across all app users.
Suppose that A is different from the typical user in this
attribute, in the sense that f(A) not equal to f*. Is A more likely to adopt
the app if the friend B is similar to A, or if B is similar to the typical app
user? We now say that a(i, j) is the adoption probability of a user A who has
one friend B using the app, with f(A) = i and f(B) = j. (Note that f* = 0
according to our notation, since 0 is the most prevalent nationality in the
app.) a(i, i)/a(i, 0) > 1, indicating a clear aggregate tendency for the
question in the previous paragraph: a user A is more likely to adopt the app in
general when A’s one friend using the app is similar to A, not to the typical
app user. In contrast, when f(A) = f* , the ratio a(0, 0)/a(0, i) is balanced
around 1, so there is no clear tendency in adoption probabilities between the
case f(B) = f* and f(B) not equal to f* : for users who have the modal
attribute value, the attribute value of their friend does not have a comparably
strong effect.

Figure 3: The probability that a user adopts the app given
that they have one friend using the app. as a function of (left) the friend’s
age offset from the median and (right) the user’s age offset from the median. The
left plot indicates no apparent relationship between the age of the friend and
that the user adopts. In contrast, the right plot illustrates that young users
and users who are aged between 10 and 30 years above the median age are more
likely to adopt. Users who are more than 40 years older than the median age are
less likely to adopt. The probabilities were binned by age into 20 equally
populated bins and the reported adoption probabilities are bootstrap estimates.
The thick central line is the median bootstrap estimate of the mean, while the
three outer bands indicate the 68%, 95%, and 99.7% confidence-intervals.
For an app to have long term success we expect that it needs
to maintain a relatively high level of user retention. We would like to have a
model of retention that characterizes not only whether an individual will log
into the app the very next day, but for any day subsequent to their first
login.
We start with the population of newly installed users, n(0),
and assume that at every time step each user has a constant probability of
leaving, x0. This mechanism gives rise to exponential decay:
dn(t)/dt = - x0n(t) →
n(t) = n(0) exp(−x0 t),
where n(t) is the number of app users at time t. It turns
out that this model does not yield a good fit to the data. However, the fit
improves if we introduce a second parameter to the model by fitting from the
second day; that is, we fit both for the decay rate, x0 , and the
fraction of users that returned on day 2. With this relaxation from fitting day
1, the model becomes
n(t) = An(0) exp(−x0 t).
It is interesting that the exponential decay model fits the
day 2 and onward trend well while not fitting day 1: it is reasonable to expect
that there is a discontinuous transition in the probability of returning given
an install versus an install and a return the following day. Day 1 users are
dominated by those who use the app exactly once, whereas all the other days
contain a signal from users who exhibited at least some level of continued
interest in the app
There are a number of further aspects of the app ecosystem
that would be interesting to take into account in future work. First, app
adoption is driven in part by the marketing and other recruitment strategies of
the app owners. Although our models incorporate the numbers of new users coming
to the app over time, they do not differentiate between organic growth and
advertising-driven growth. Furthermore, it is not clear whether sociality of
apps might accelerate growth or decline or both. Finally, it is unclear whether
some features might be early harbingers of future behavior, e.g. whether the
change in retention of long-time or recently acquired users is more useful in
forecasting the eventual adoption of the app.
References:
http://arxiv.org/abs/1503.06870
: The Lifecycles of Apps in a Social Ecosystem – [ Isabel Kloumann, Lada Adamic,
Jon Kleinberg, Shaomei Wu]
No comments:
Post a Comment