Social media represent powerful tools of mass communication and information diffusion. They played a pivotal role during recent social uprisings and political mobilizations across the world. Here we present a study of the Gezi Park movement in Turkey through the lens of Twitter. We analyze over 2.3 million tweets produced during the 25 days of protest occurred between May and June 2013. We first characterize the spatio-temporal nature of the conversation about the Gezi Park demonstrations, showing that similarity in trends of discussion mirrors geographic cues. We then describe the characteristics of the users involved in this conversation and what roles they played. We study how roles and individual influence evolved during the period of the upheaval. This analysis reveals that the conversation becomes more democratic as events unfold, with a redistribution of influence over time in the user population. We conclude by observing how the online and offline worlds are tightly intertwined, showing that exogenous events, such as political speeches or police actions, affect social media conversations and trigger changes in individual behavior.
Our analysis is based on data collected from Twitter. The dataset collected for our study comes from a 10% random sample of all tweets streamed. The observation period covers 27 days, from May 25th to June 20th, 2013. The short period prior to the protest inception is used as baseline to define user activity and interests. Our sample not only contains information about the tweets, but also meta-data about the users, including their screen names, follower/followee counts, self-reported locations, and more. Additionally, for content posted with a GPS-enabled smartphone, we have access to the geographic location from which the tweets were generated. The hashtags were manually divided in three categories: general-interest hashtags, local protest related ones, and finally those used by government supporters. Overall, we collected 2,361,335 tweets associated with the Gezi Park movement, generated by 855,616 distinct users and containing a total of 64,668 unique hashtags. Among these 2.3 million tweets, 1,475,494 are retweets and 47,163 are replies from one users to another. Also, 43,646 tweets have latitude/longitude coordinates. We adopt this subset of geolocated tweets to study the spatio-temporal nature of the protest.


 The dark cells along the diagonal indicate that most users have a balanced ratio of ingoing and outgoing ties. Users below the diagonal follow more than they are followed. Note that most users are allowed to follow at most 1000 people. Finally, above the diagonal, we observe users with many followers. Note the presence of extremely popular users with hundreds of thousands or even millions of followers.
 The y-axis shows the ratio between number of followees and followers of a given user; the x-axis shows the ratio between the number of retweets produced by a user and the number of times other users retweet that user. In other words, the vertical dimension represents social connectivity, whereas the horizontal dimension accounts for information diffusion. We can draw a vertical line to separate influential users on the left (i.e., those whose content is most often retweeted by others) and information consumers on the right (those who mostly retweet other people’s content). Influential users can be further divided in two classes: those with more followers than followees (bottom-left) and those with fewer followers (top-left), which we call hidden influentials. Similarly, information consumers can be divided in two groups–rebroadcasters with a large audience (bottom-right), and common users (top-right). It shows a static picture of aggregated data over the 27-day observation period. To study how roles evolve as events unfold, we carried out a longitudinal analysis whose results are provided in next figure.

 Many users changed their screen names five or more times. This was an unusual observation that attracted our attention.

Our analysis is based on data collected from Twitter. The dataset collected for our study comes from a 10% random sample of all tweets streamed. The observation period covers 27 days, from May 25th to June 20th, 2013. The short period prior to the protest inception is used as baseline to define user activity and interests. Our sample not only contains information about the tweets, but also meta-data about the users, including their screen names, follower/followee counts, self-reported locations, and more. Additionally, for content posted with a GPS-enabled smartphone, we have access to the geographic location from which the tweets were generated. The hashtags were manually divided in three categories: general-interest hashtags, local protest related ones, and finally those used by government supporters. Overall, we collected 2,361,335 tweets associated with the Gezi Park movement, generated by 855,616 distinct users and containing a total of 64,668 unique hashtags. Among these 2.3 million tweets, 1,475,494 are retweets and 47,163 are replies from one users to another. Also, 43,646 tweets have latitude/longitude coordinates. We adopt this subset of geolocated tweets to study the spatio-temporal nature of the protest.
Spatio-temporal cues of the conversation
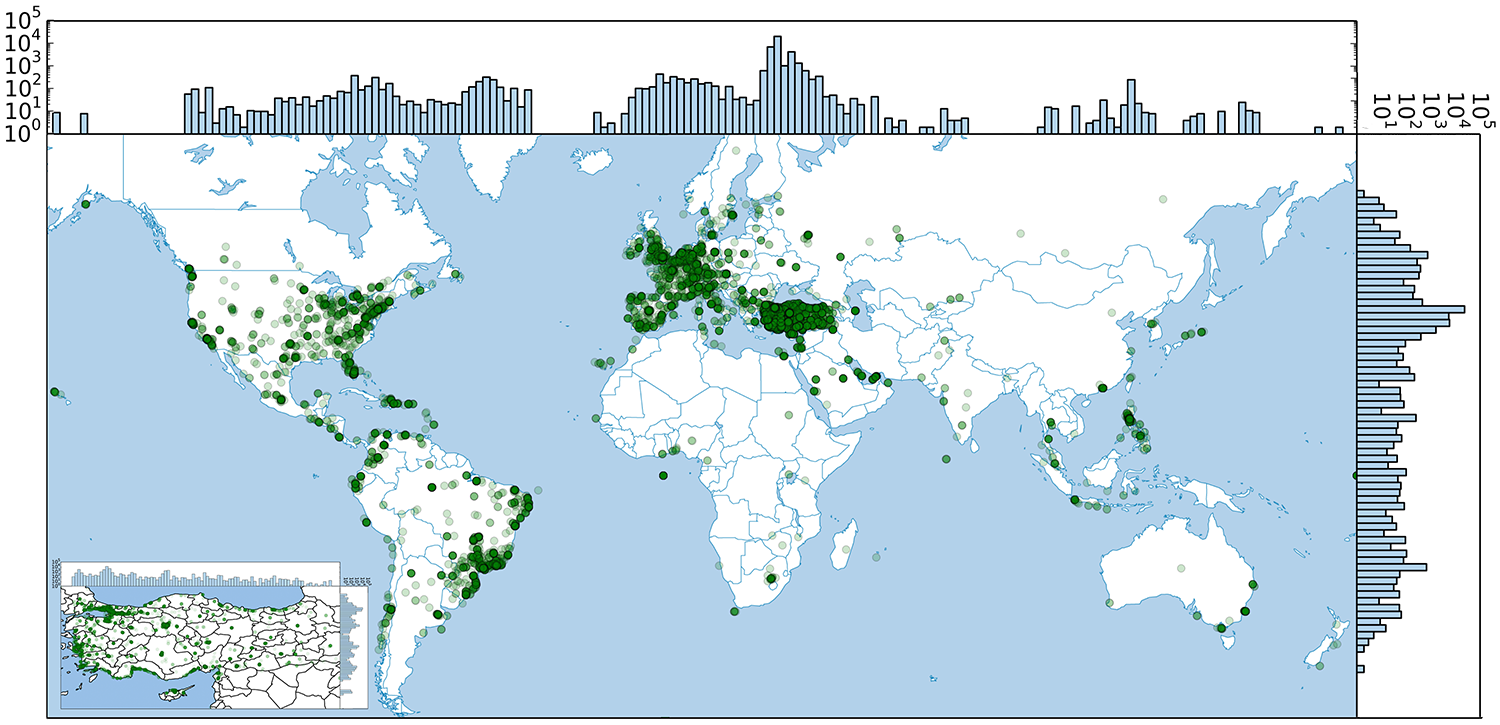
Our first analysis aims at determining the extent to which the discussion about Gezi Park attracted individual attention inside the national boundaries of Turkey, where the movement began, and how much of this conversation spread worldwide.
Geographic distribution of tweets in our sample related to the discussion of Gezi Park events. The
histograms represent the total volume by latitude and longitude. Content production crossed the Turkish national boundaries and spread in Europe, North and South America.
Distribution of top 10 languages in tweets about the protest. Language information was extracted from the tweet meta-data.
Each location is described by a frequency vector of occurrences of the observed trends. The similarity between pairs of cities is calculated as the cosine similarity of their trends frequency vectors. Above the matrix we show the dendrogram produced by hierarchical clustering, where it is possible to appreciate the separation in three clusters. Such clusters neatly correspond to three different geographic areas of Turkey. Physical proximity seems to play a crucial role in determining the similarity of topical interests of individuals, consistent with other recent results.
We wanted to determine whether the activity on social media mirrored on-the-ground events, and whether bursts of online attention coincided with real-world protest actions. We analyzed the time series of the volume of tweets, retweets and replies occurring during the 27-day-long observation window.
The discussion was driven by bursts of attention that largely corresponded to major on-the-ground events , similar to what has been observed during other social protests. It is also worth noting that the numbers of tweets and retweets are comparable throughout the entire duration of the conversation, suggesting a balance between content production and consumption. In the middle panel of Figure 4 we report the number of users involved in the conversation at a given time, and the cumulative number of distinct users over time (dashed red line); similarly, in the bottom panel of the figure, we show the total number of hashtags related to Gezi Park observed at a given time, and the cumulative number of distinct hashtags over time. We note that approximately 60% of all users observed during the entire discussion joined in the very first few days, whereas additional hashtags emerged at a more regular pace throughout a longer period. This suggests that the conversation acquired traction immediately, and exploded when the first on-the-ground events and police action occurred.
User roles and their evolution
Our second experiment aims at investigating what roles users played in the Gezi Park conversation and how they exercised their influence on others. We also seek to understand whether such roles changed over time, and, if so, to what extent such transformation reshaped the conversation.
First, we observed that the classes of information producers (influentials and hidden influentials) are relatively stable over time; together they include more than 50% of users every day, suggesting that many individuals in the conversation had large audiences, and the content they produced was heavily rebroadcasted by others (information consumers as well as other nfluentials). On the other hand, information consumers show strong fluctuation: starting from an initial configuration with stable roles (May 29–31), common users and rebroadcasters subsequently exhibit large aggregate displacements in the role space (June 1–4). We also note a redistribution of the users in each role: at the beginning of the protest a large fraction represents common users and rebroadcasters, while, as time passed and events unfolded, these two classes shrank. This suggests that common users and rebroadcasters acquired visibility and influence over time.
Online behavior and exogenous factors
Our concluding analysis focused on the way on-the-ground events affected online user behavior.
Among the many users who changed
screen names, this chart plots the fractions who
adopted different nicknames over time in respons
to external events.
Conclusion
Our analysis of the spatial dynamics of the communication brought two different interesting findings. First, we observed that the discussion about Gezi Park events spread worldwide, and a sustained number of tweets was produced over time outside of Turkey — in Europe, North and South America. International attention was underscored by trending hashtags related to Gezi Park at the worldwide level. Second, we observed that local trends followed geographic and political patterns. Among the 12 cities whose trends we monitored, three clear geographic clusters emerge. This result is consistent with our recent analysis of geospatial spreading patterns of Twitter trends Focusing on users, we identified four types of roles (common users, rebroadcasters, influentials and hidden influentials). We tracked their evolution over time as events unfolded. As time passed, the discussion about Gezi Park became more democratic, with an increased number of influential users. Our analysis concluded by studying an effect of real-world events, such as political speeches, on online user behavior. We found that individuals responded to such external provocations by exhibiting collective actions, namely the change of their Twitter screen names to reflect sobriquets attributed to them by their political leaders.
Reference:
Center for Complex Networks and Systems Research School of Informatics and Computing, Indiana University, Bloomington, USA
http://cnets.indiana.edu/blog/2014/06/26/best-paper-award-at-websci14/
http://cnets.indiana.edu/blog/2014/06/26/best-paper-award-at-websci14/
No comments:
Post a Comment